
AI-Powered Observability with Pydantic Logfire MCP
Lightning Talk with Samuel Colvin, Founder and CEO of Pydantic

Samuel Colvin, founder and CEO of Pydantic, demonstrated how to build observable AI applications using Pydantic AI and Logfire. The presentation showcased practical workflows for debugging AI applications and using MCP servers to automatically fix bugs.
Introduction to the Pydantic Stack
Eleanor introduced Samuel as someone with a reputation for "taking stuff that's headache-inducing and making it accessible and manageable."
"Pydantic Logfire happy user. It's the first thing I drop into every new project because it just makes observability so easy."
Getting Started with Pydantic AI
The initial demonstration showed a basic Pydantic AI example with structured output. Samuel emphasized the library's commitment to type safety:
"We take type safety very seriously within Pydantic AI. So if you look at
Agent, it is generic in the output type, which means that when we access result or output, it is an instance of person."
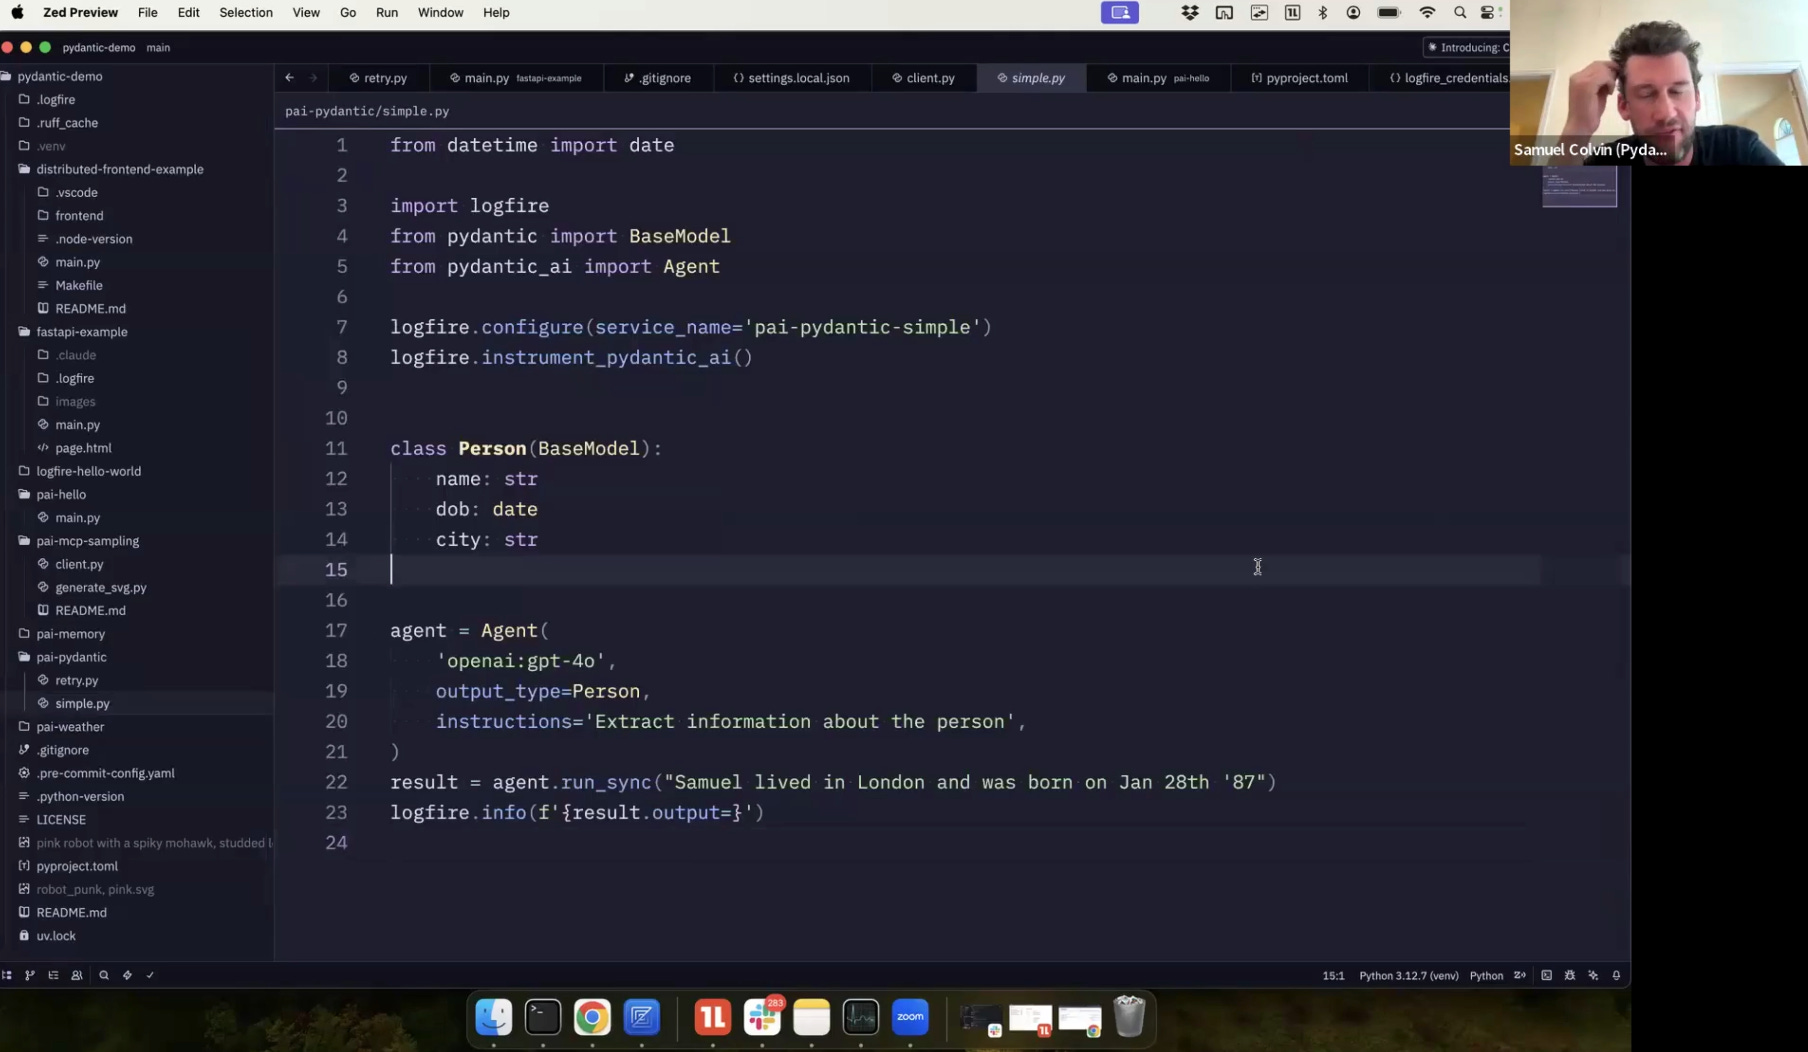
The integration with Logfire required just three lines of code:
Importing Logfire
Setting up instrumentation with a service name
Calling
instrument_pydantic_ai()to generate OpenTelemetry spans
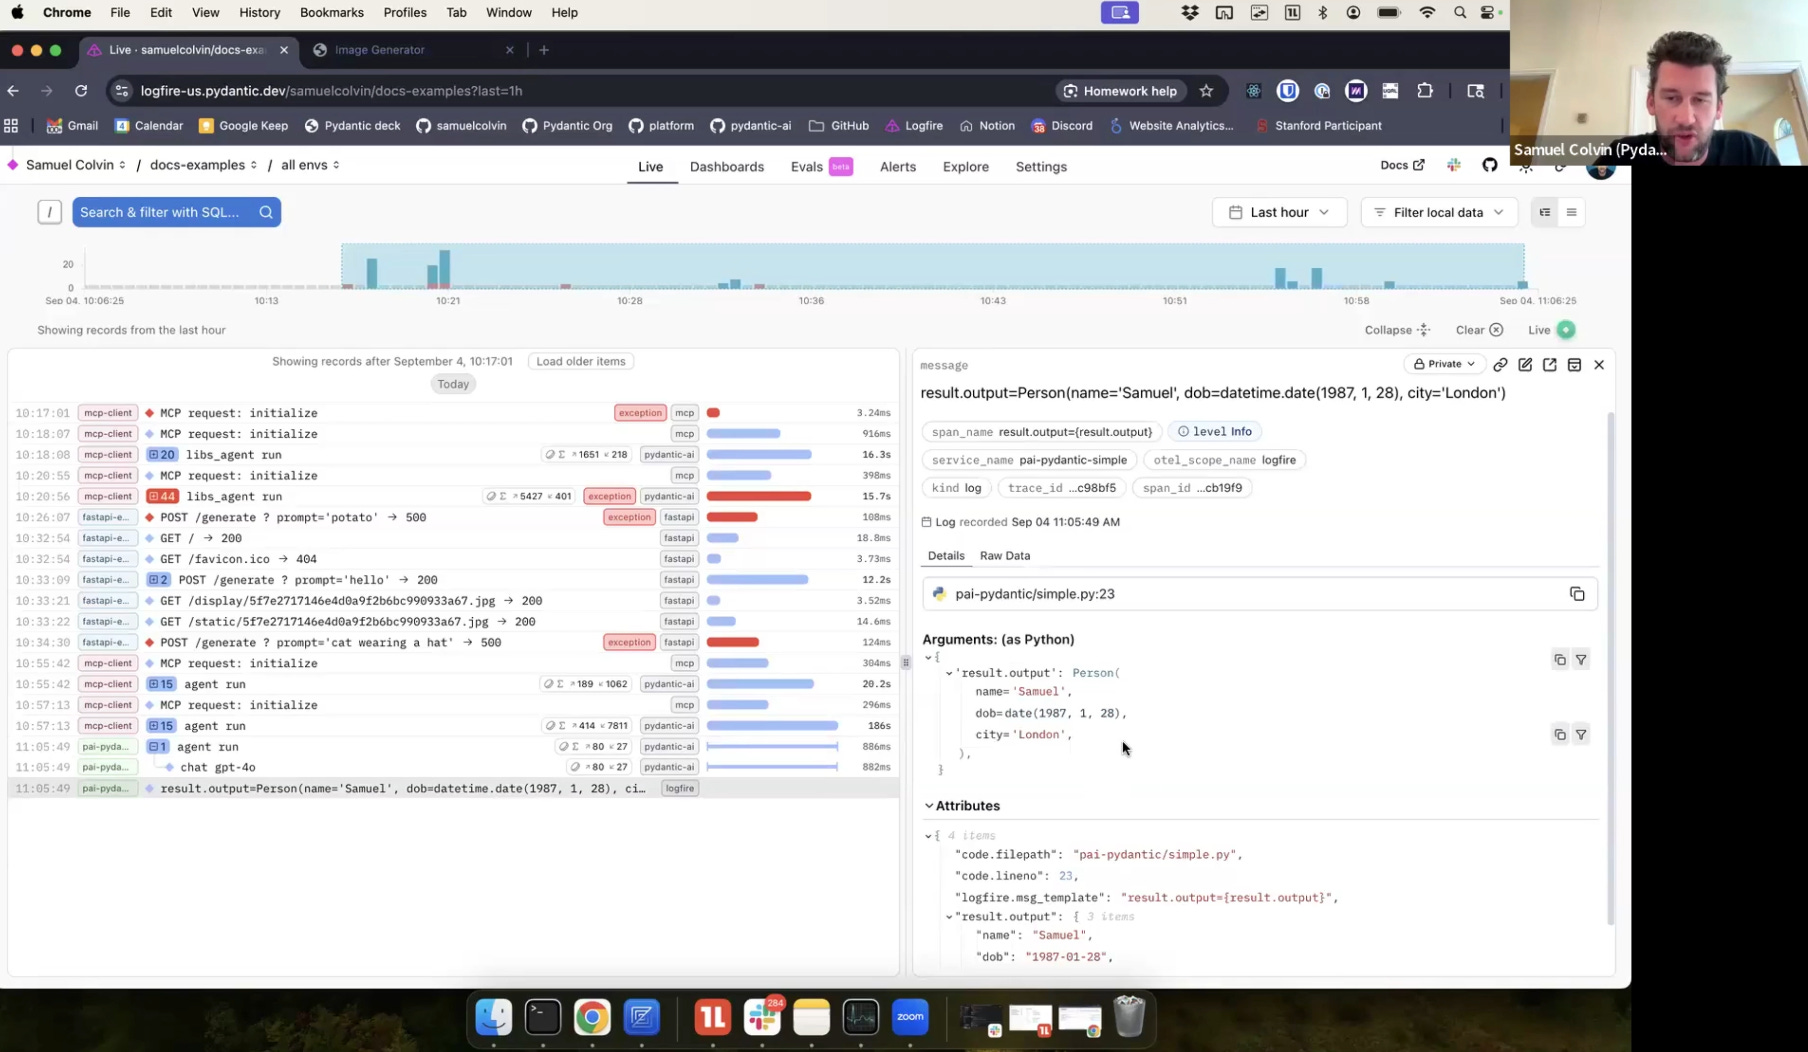
When the simple example ran, Logfire displayed comprehensive traces showing the system prompt, user input, and structured output using tool calling. Samuel highlighted an important UI feature:
"One thing to call out here in Logfire is we work hard to show things as if it was
repr. So although this is really structured data that we could go and query on, we display it like it's just a repr in your terminal."
Demonstrating Reflection and Validation
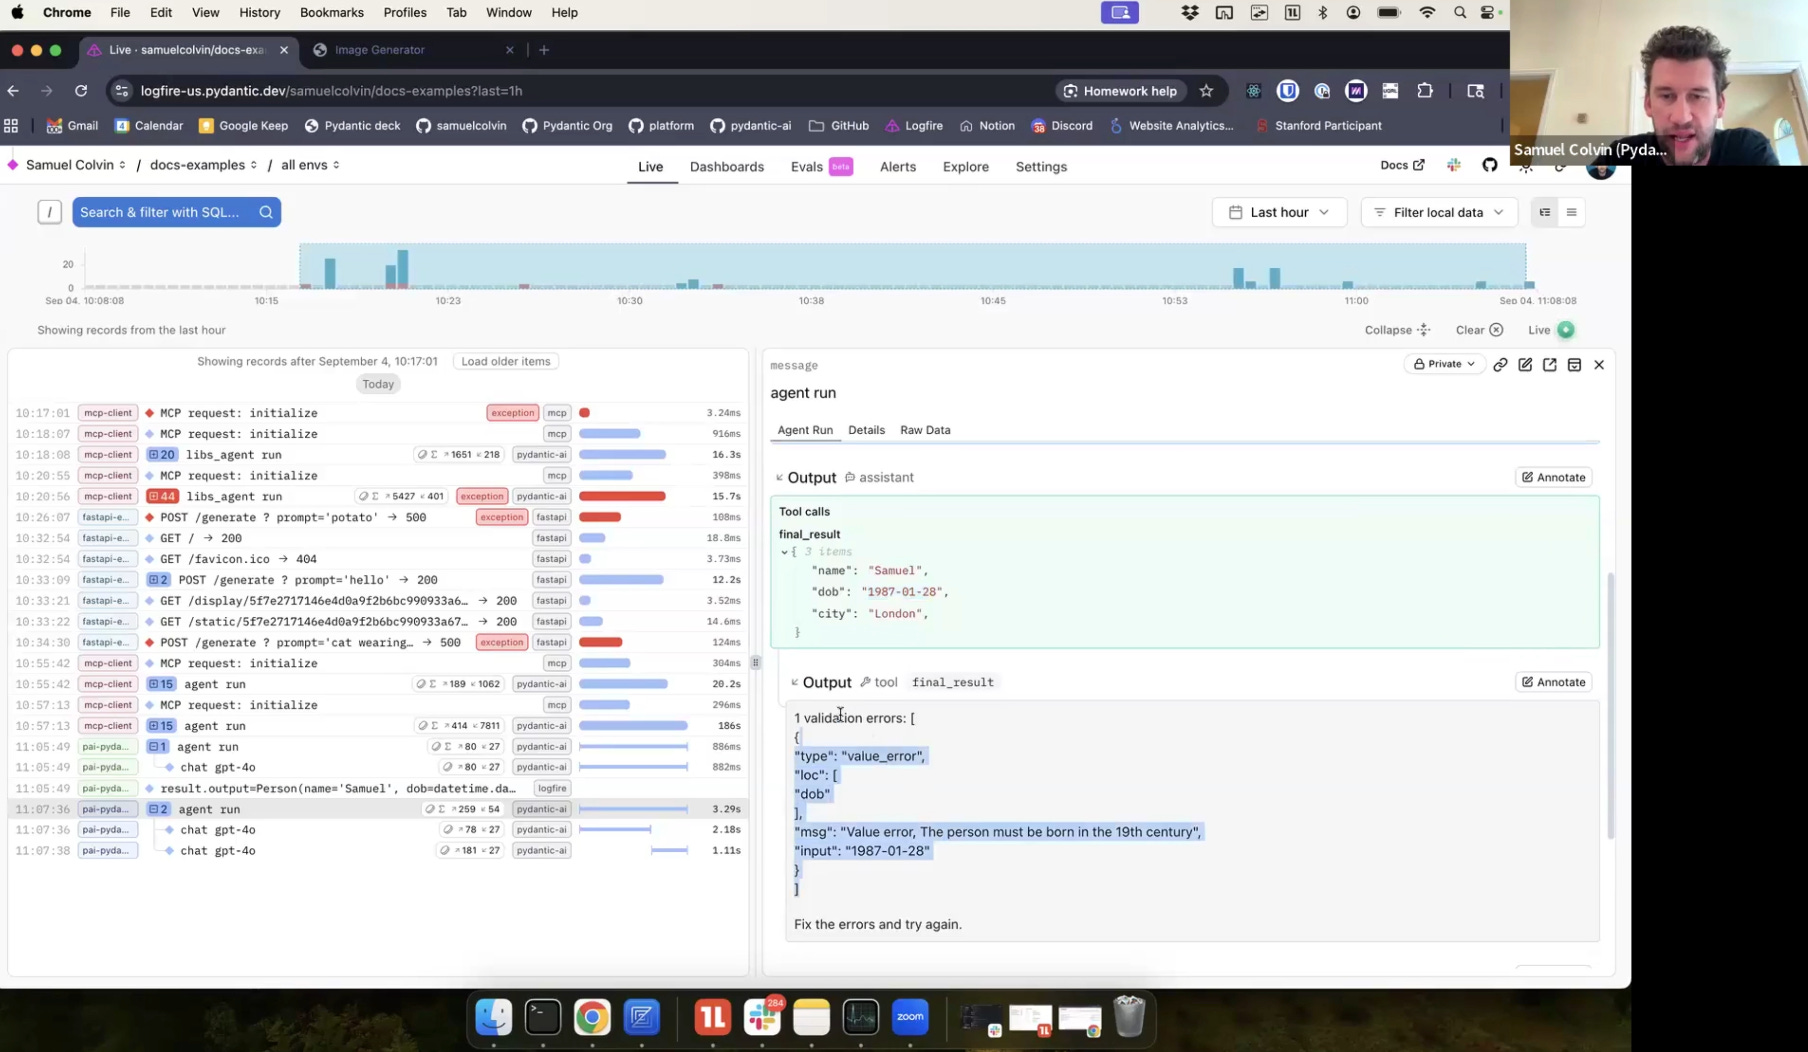
The second example showcased Pydantic AI's reflection capabilities by intentionally creating a validation error. The code required a person to be born in the 19th century, but the LLM naturally interpreted "January 28th, 87" as 1987.
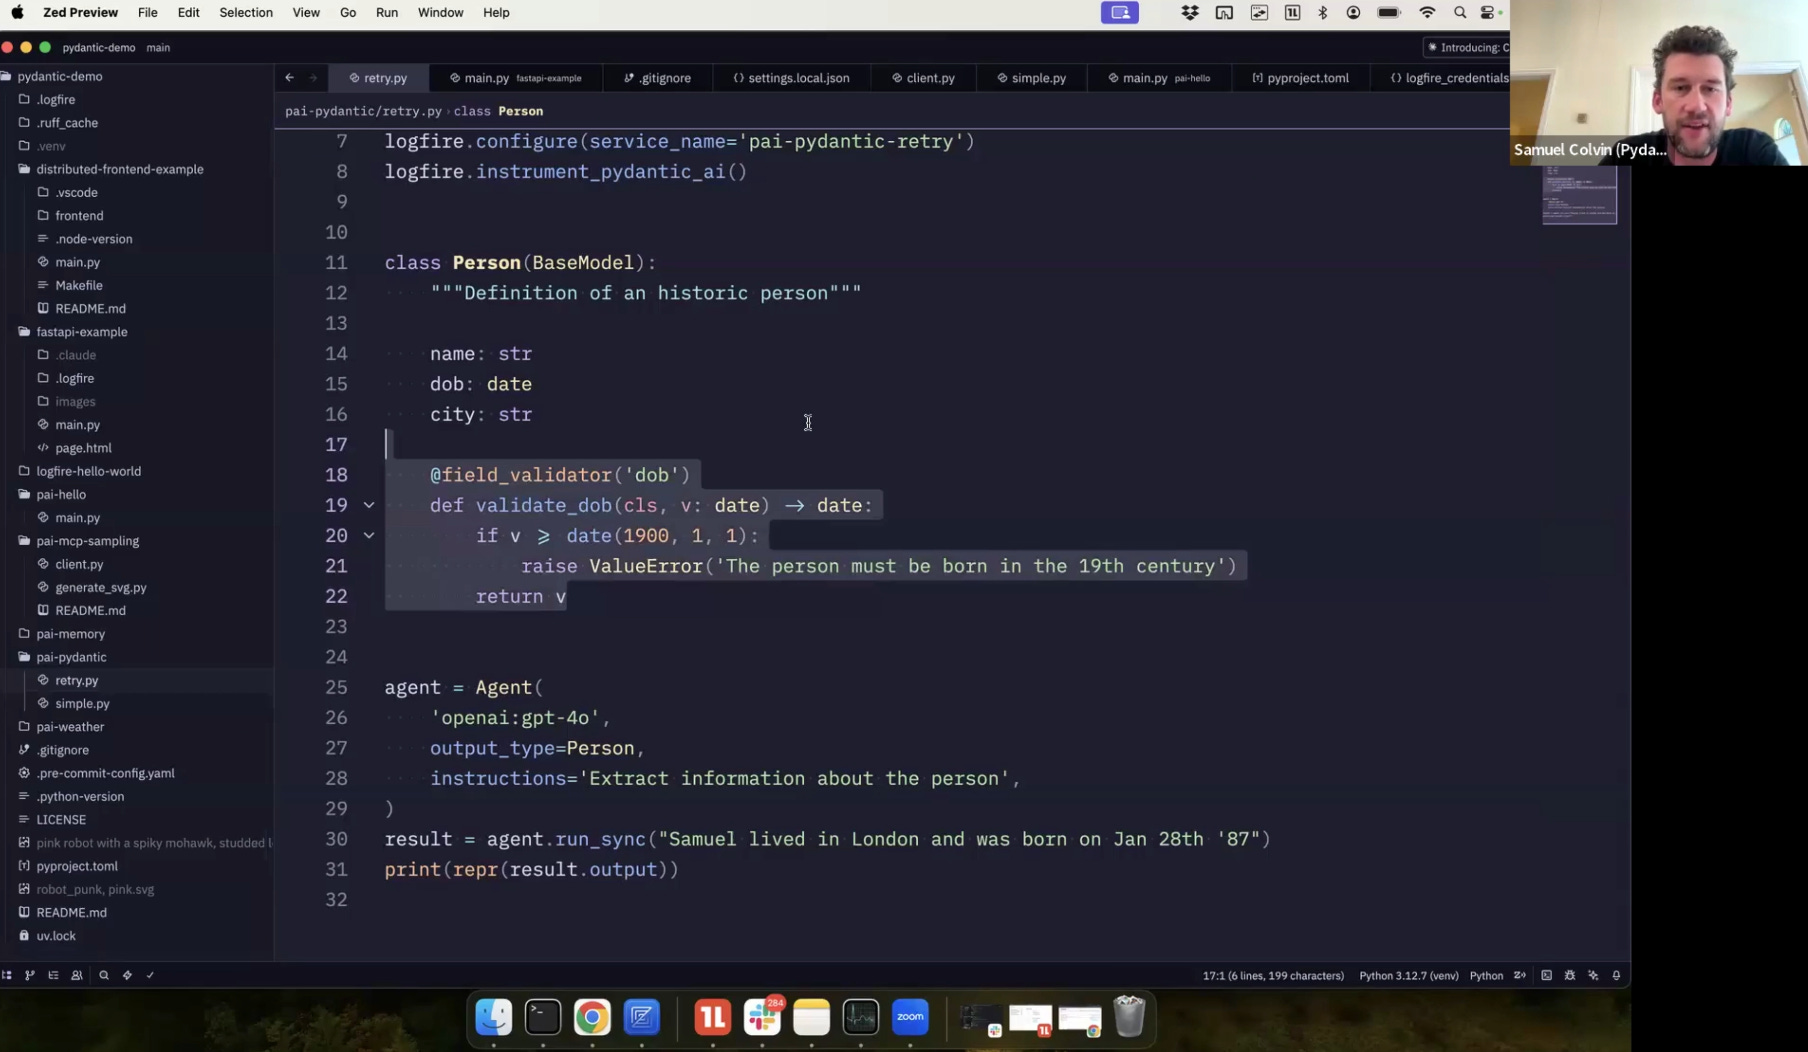
"You'd be surprised how often the model misinterprets the schema, even though it has the JSON schema, gets it wrong. And one basically prompt to retry is enough to fix the model."
Logfire captured both LLM calls, showing how the validation error was returned to the model with a request to retry, and the model successfully corrected its output to 1887.
Full-Stack Observability
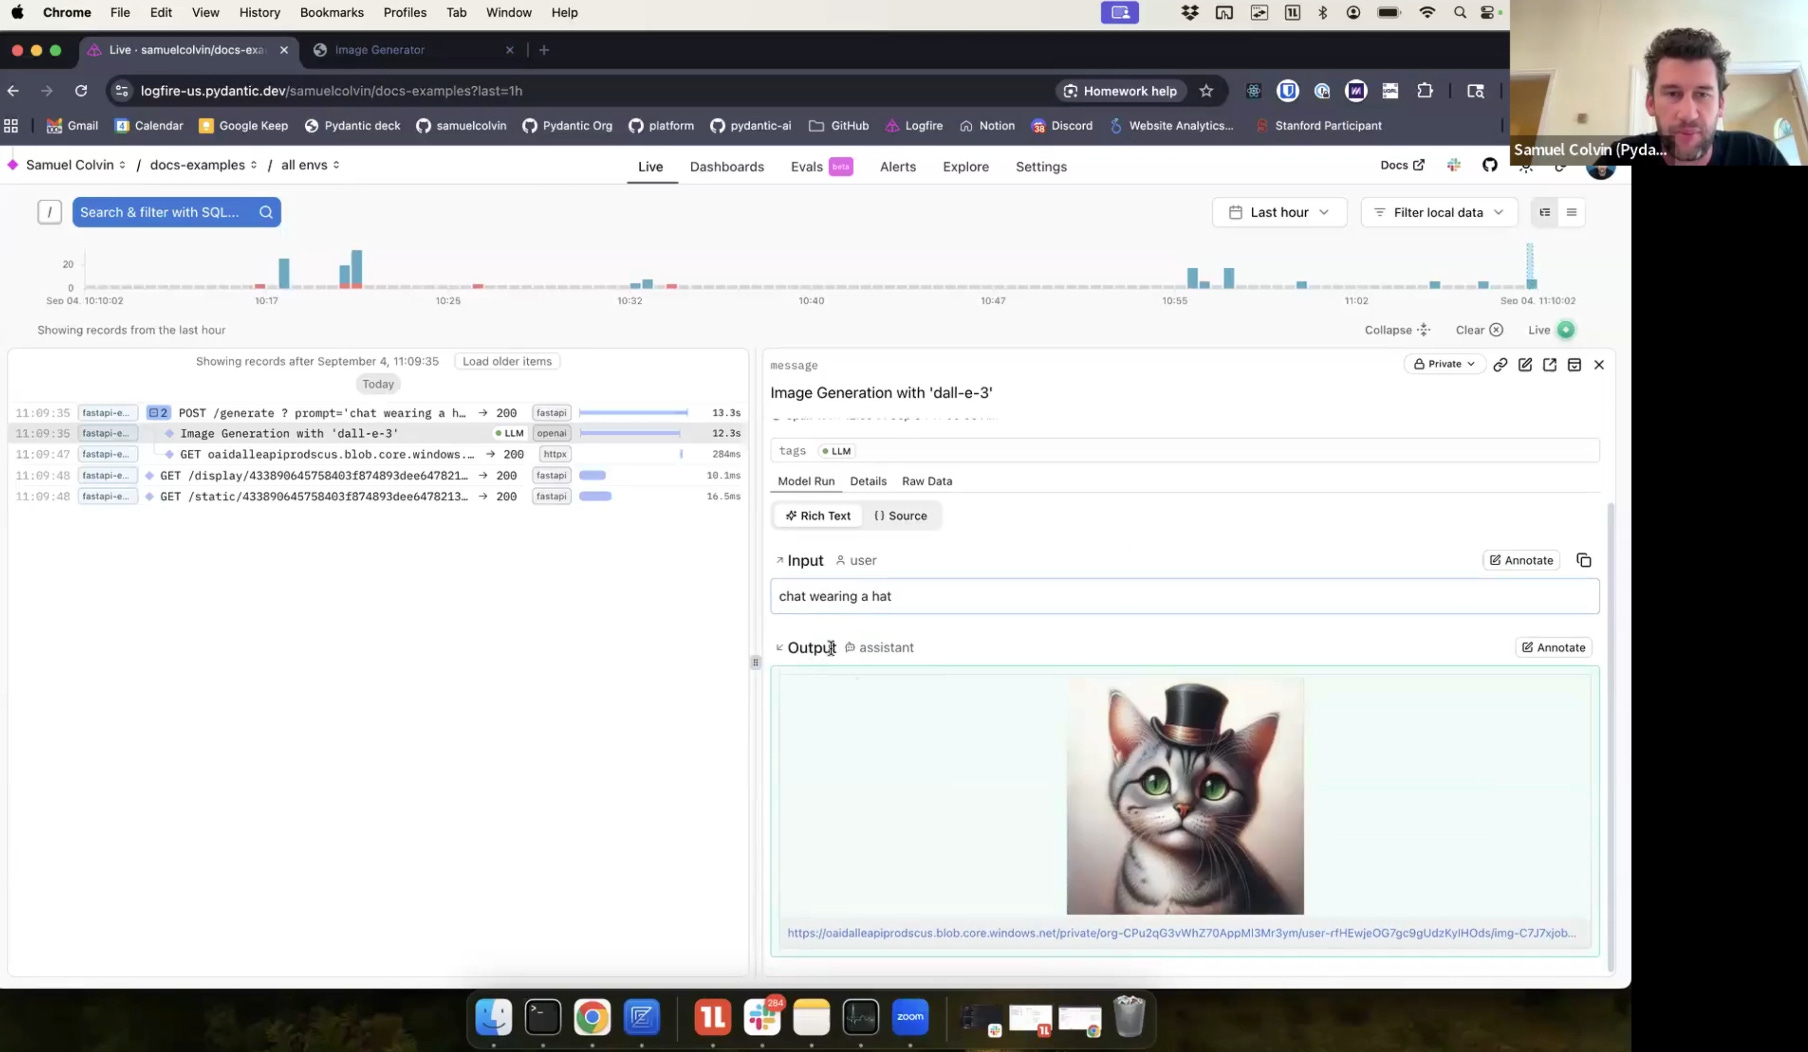
Samuel demonstrated a FastAPI application that generated images using OpenAI. This example highlighted Logfire's differentiator from other AI observability platforms:
"One of the differentiators with Logfire versus other AI observability platforms is with full observability. So you get in this case stuff about the FastAPI arguments, the headers and responses, as well as obviously the LLM call."
The traces showed not just the AI interactions but the complete request lifecycle, including the image URL generation and subsequent frontend requests.
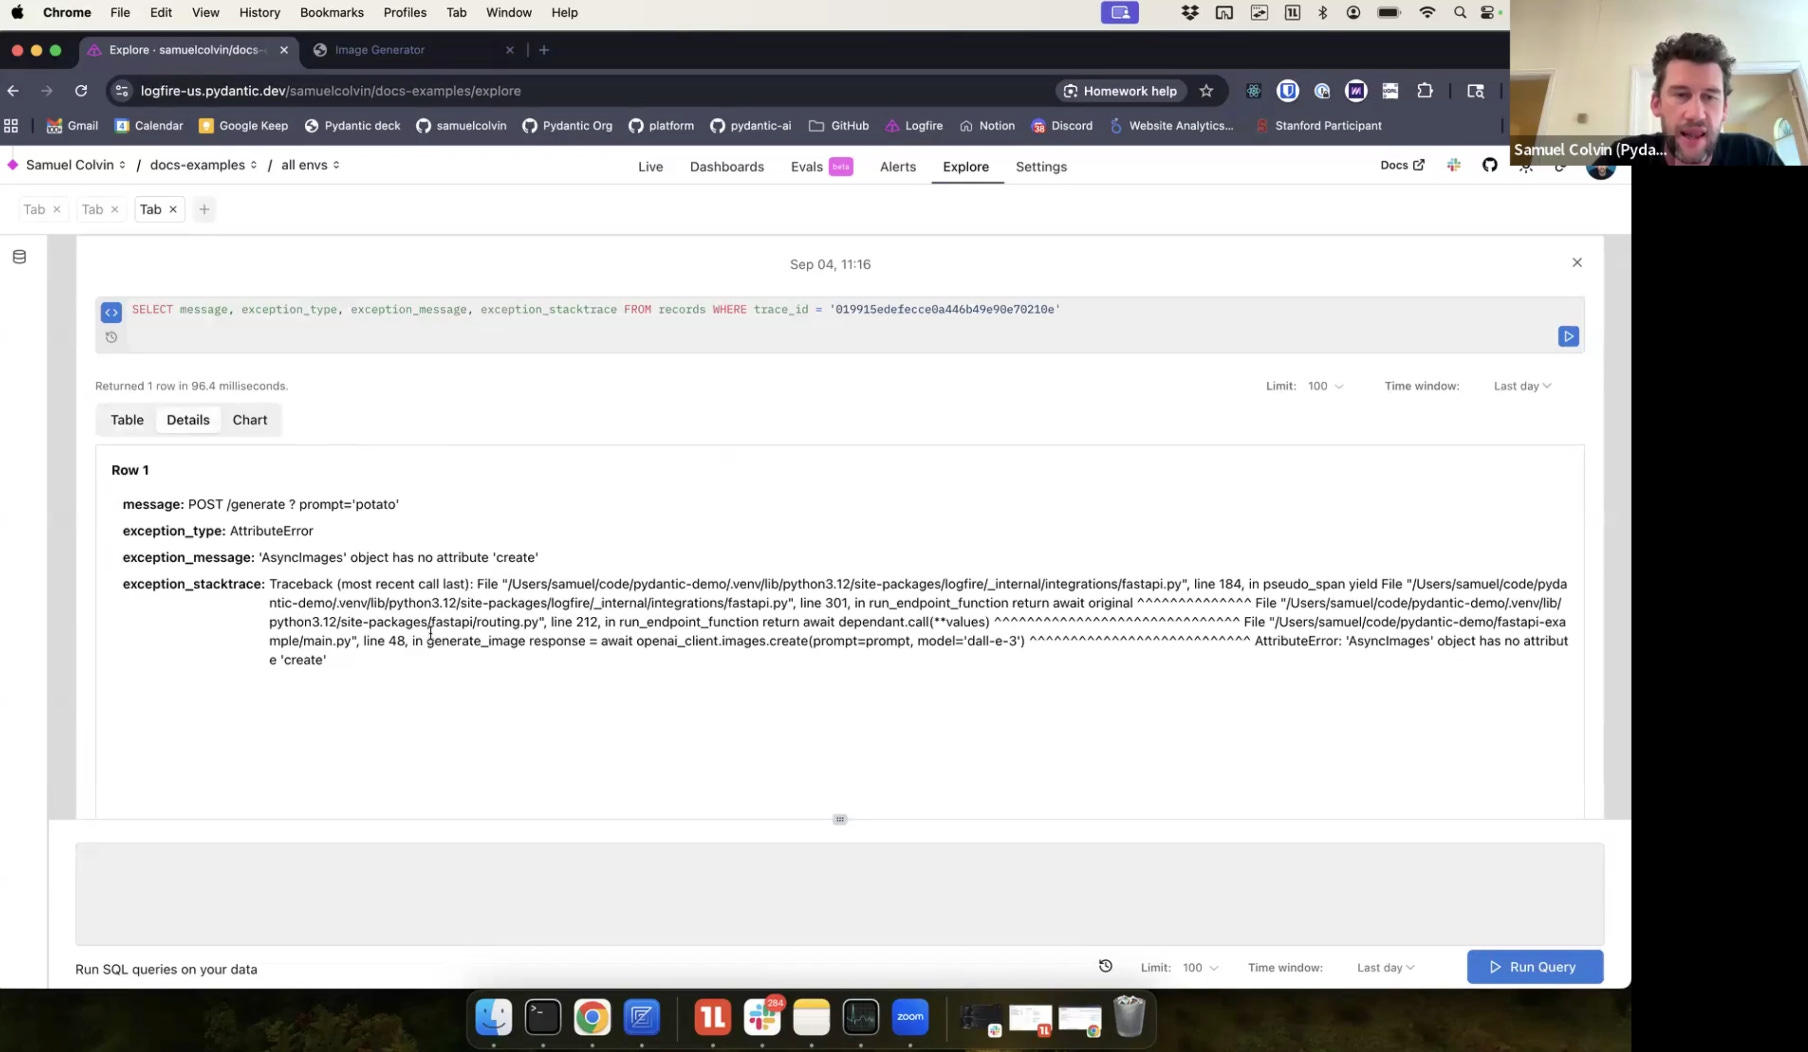
Automatic Bug Fixing with MCP
The most impressive demonstration involved using a the Logfire MCP server to automatically fix bugs. Samuel intentionally introduced an error by changing generate to create in the OpenAI SDK call, causing an AttributeError.
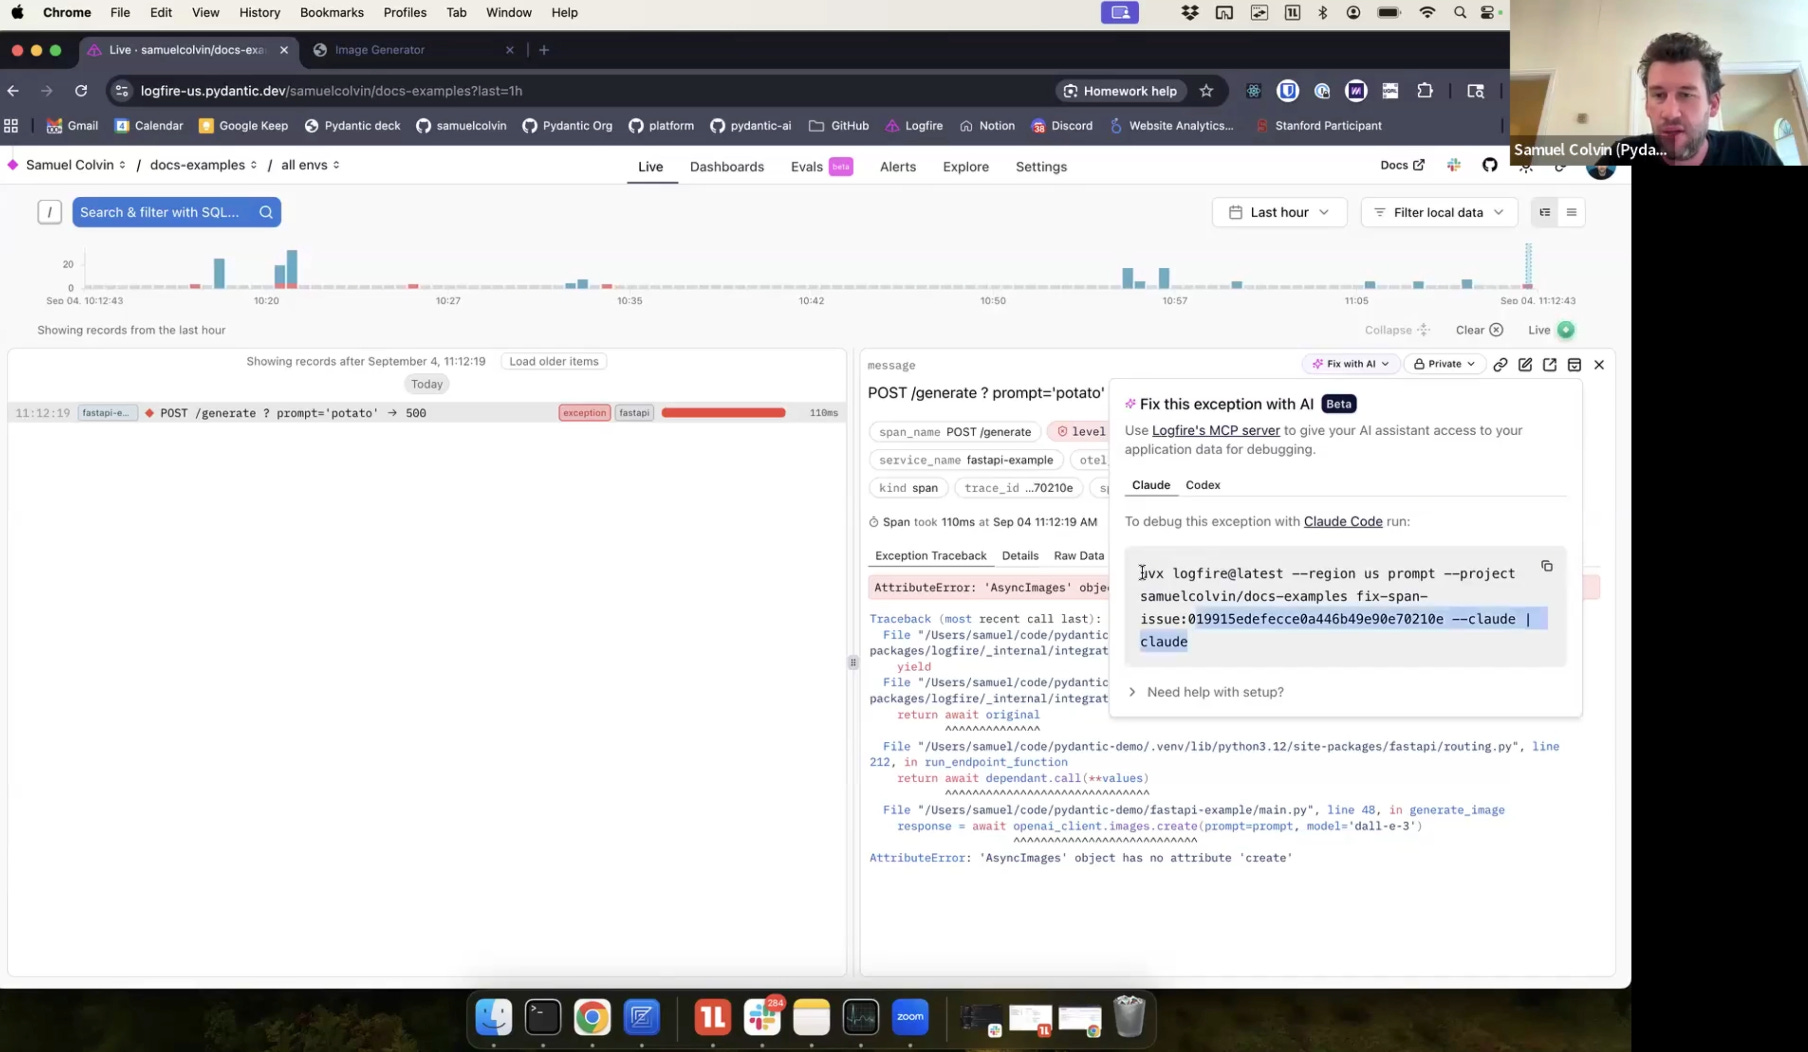
When the error occurred, Samuel used Logfire's "Fix with AI" functionality, which generated a prompt for Claude Code:
You must call MCP Logfire arbitrary query and then run this query against the database.
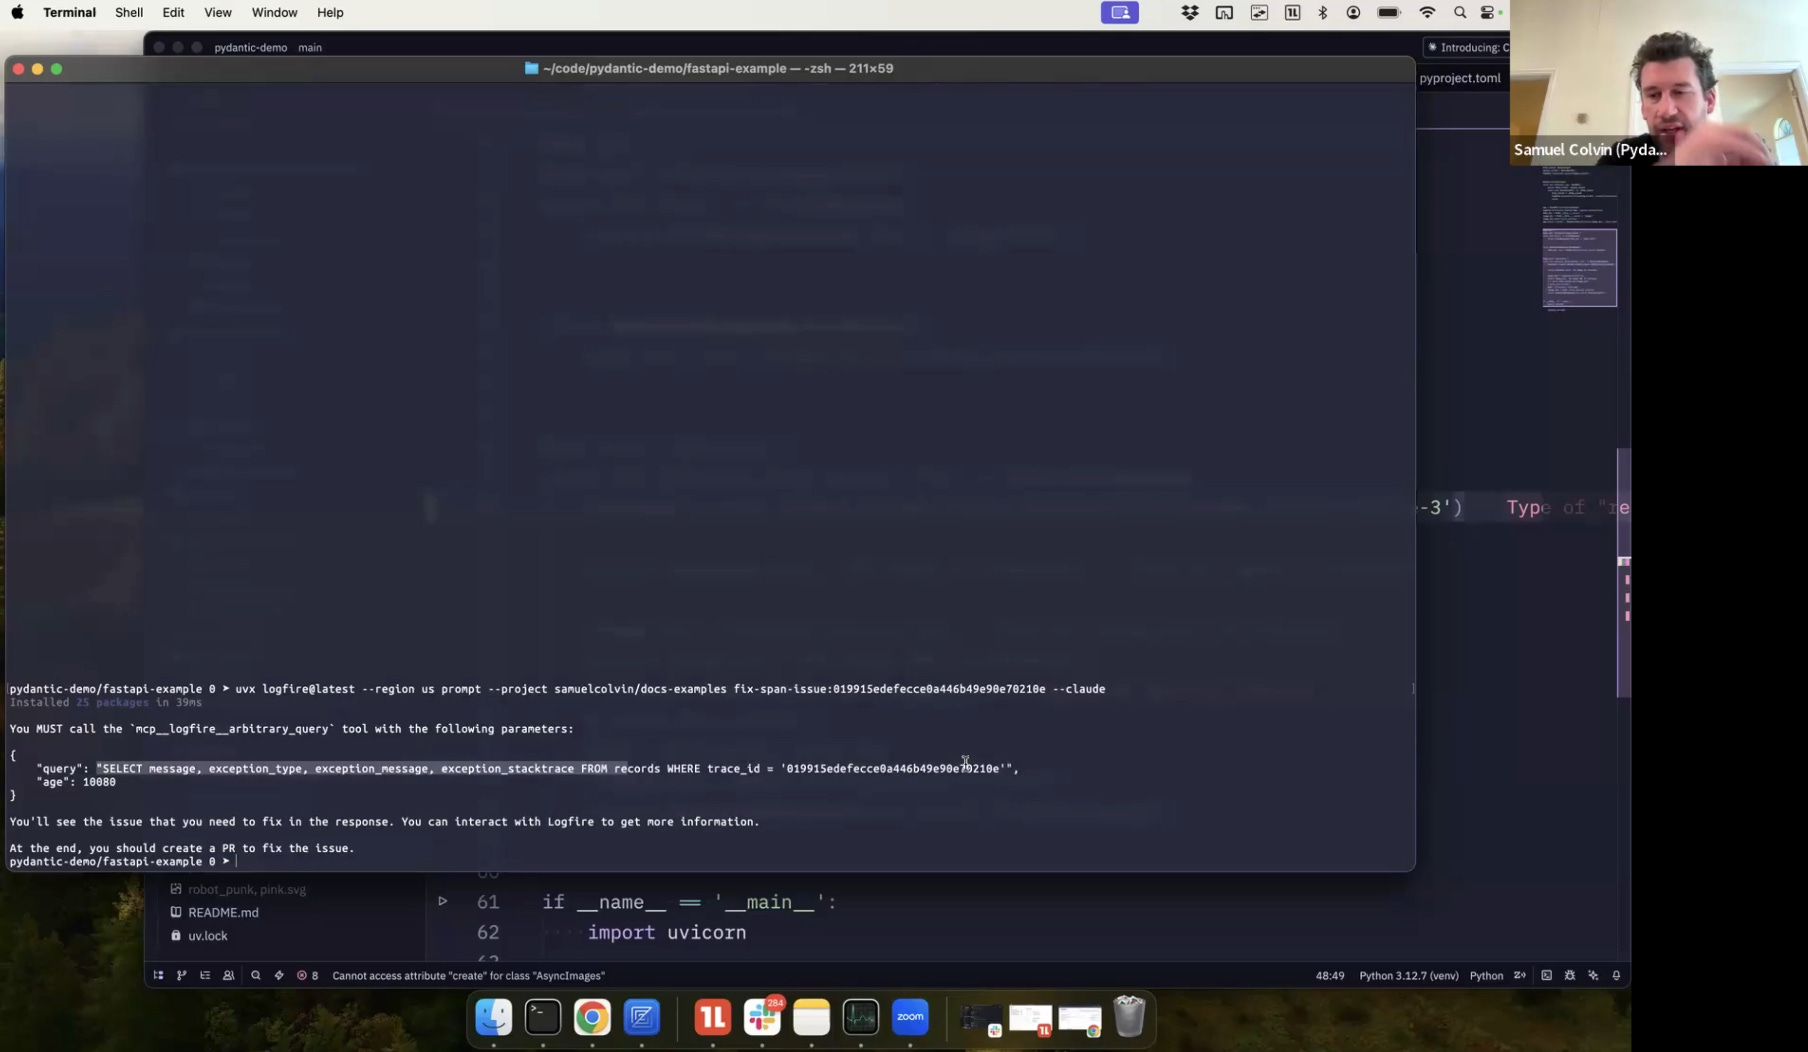
Samuel explained the power of this approach:
"LLMs are great at writing SQL. So we kick it off by giving it the SQL it wants to run to go and find this particular trace, but the power here is that where Claude or your equivalent coding tool needs to investigate further into Logfire, it can go and write its own SQL to query your data."
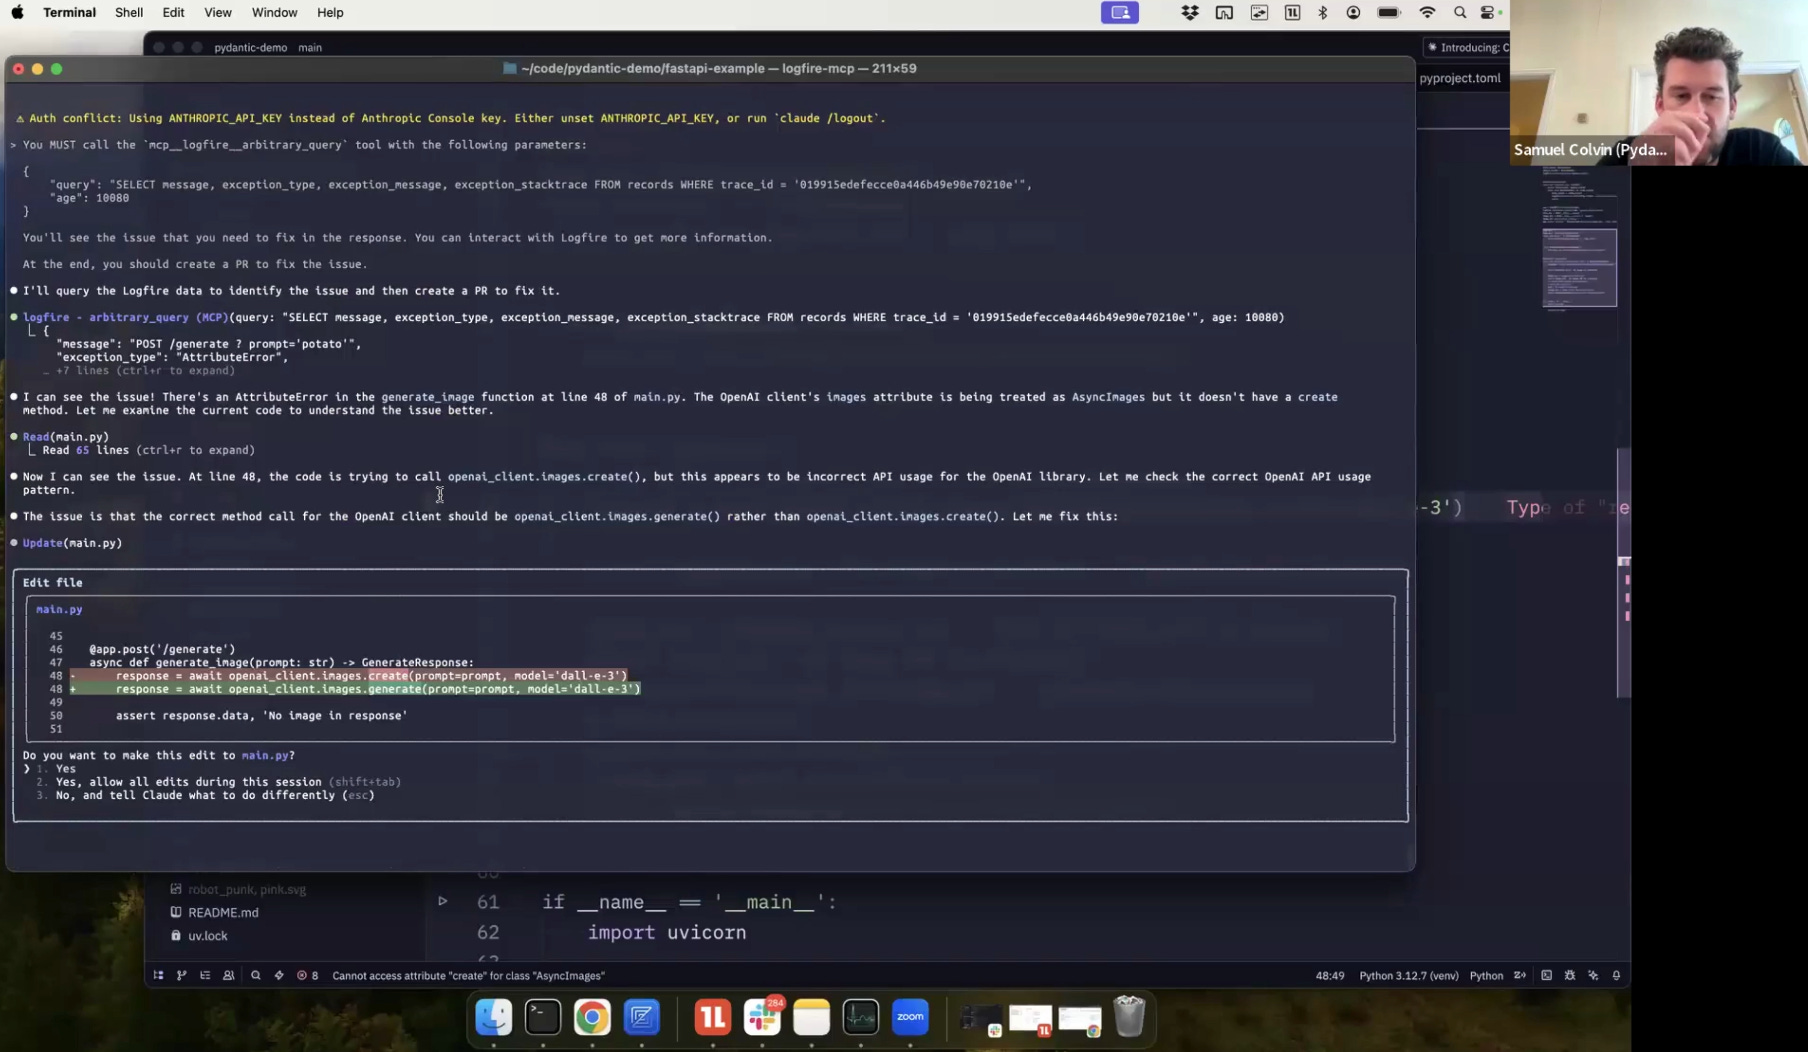
Claude successfully identified and fixed the error by querying the Logfire database, demonstrating how the MCP server provides "equivalent of a UI for the AI to go and investigate."
Arbitrary SQL Queries and Exploration
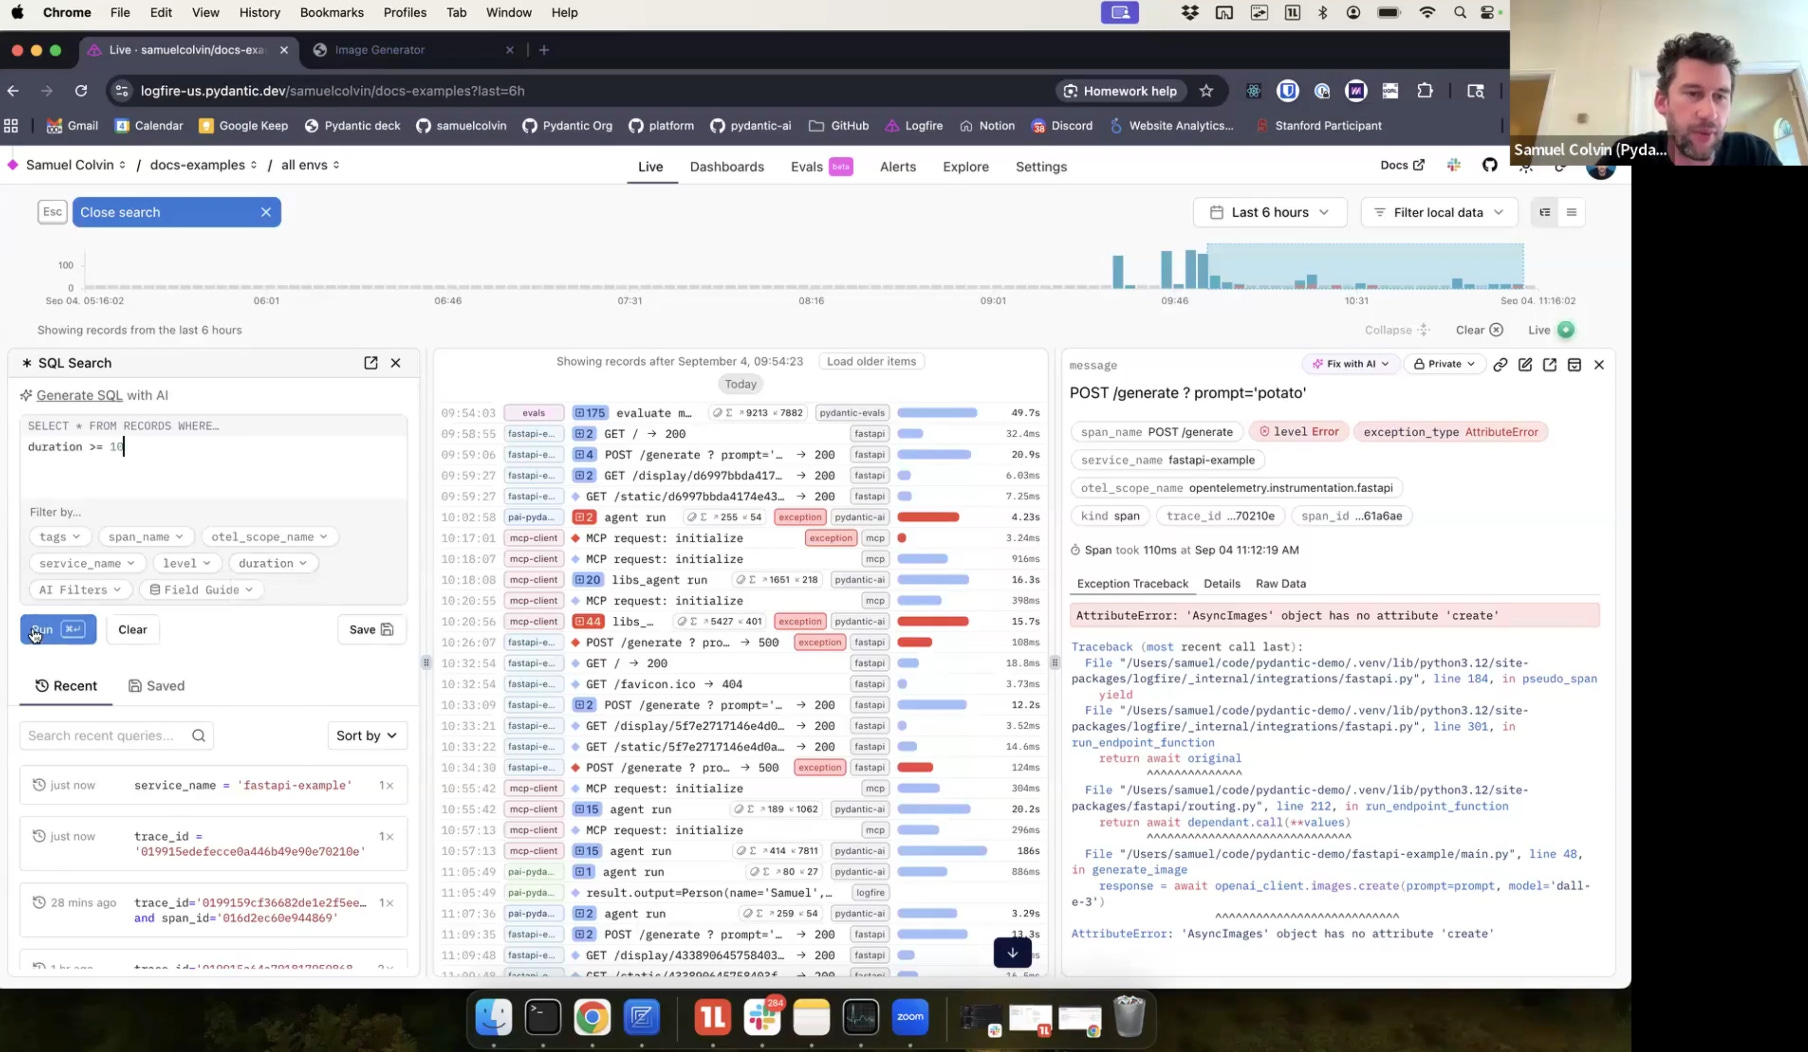
Logfire's ability to run arbitrary SQL queries emerged as a key feature. Samuel demonstrated various query capabilities:
Finding specific traces by ID
Filtering by service name
Identifying slow requests (spans longer than 10 seconds)
Using the explore view as "a kind of equivalent of a Jupyter notebook, but for our data"
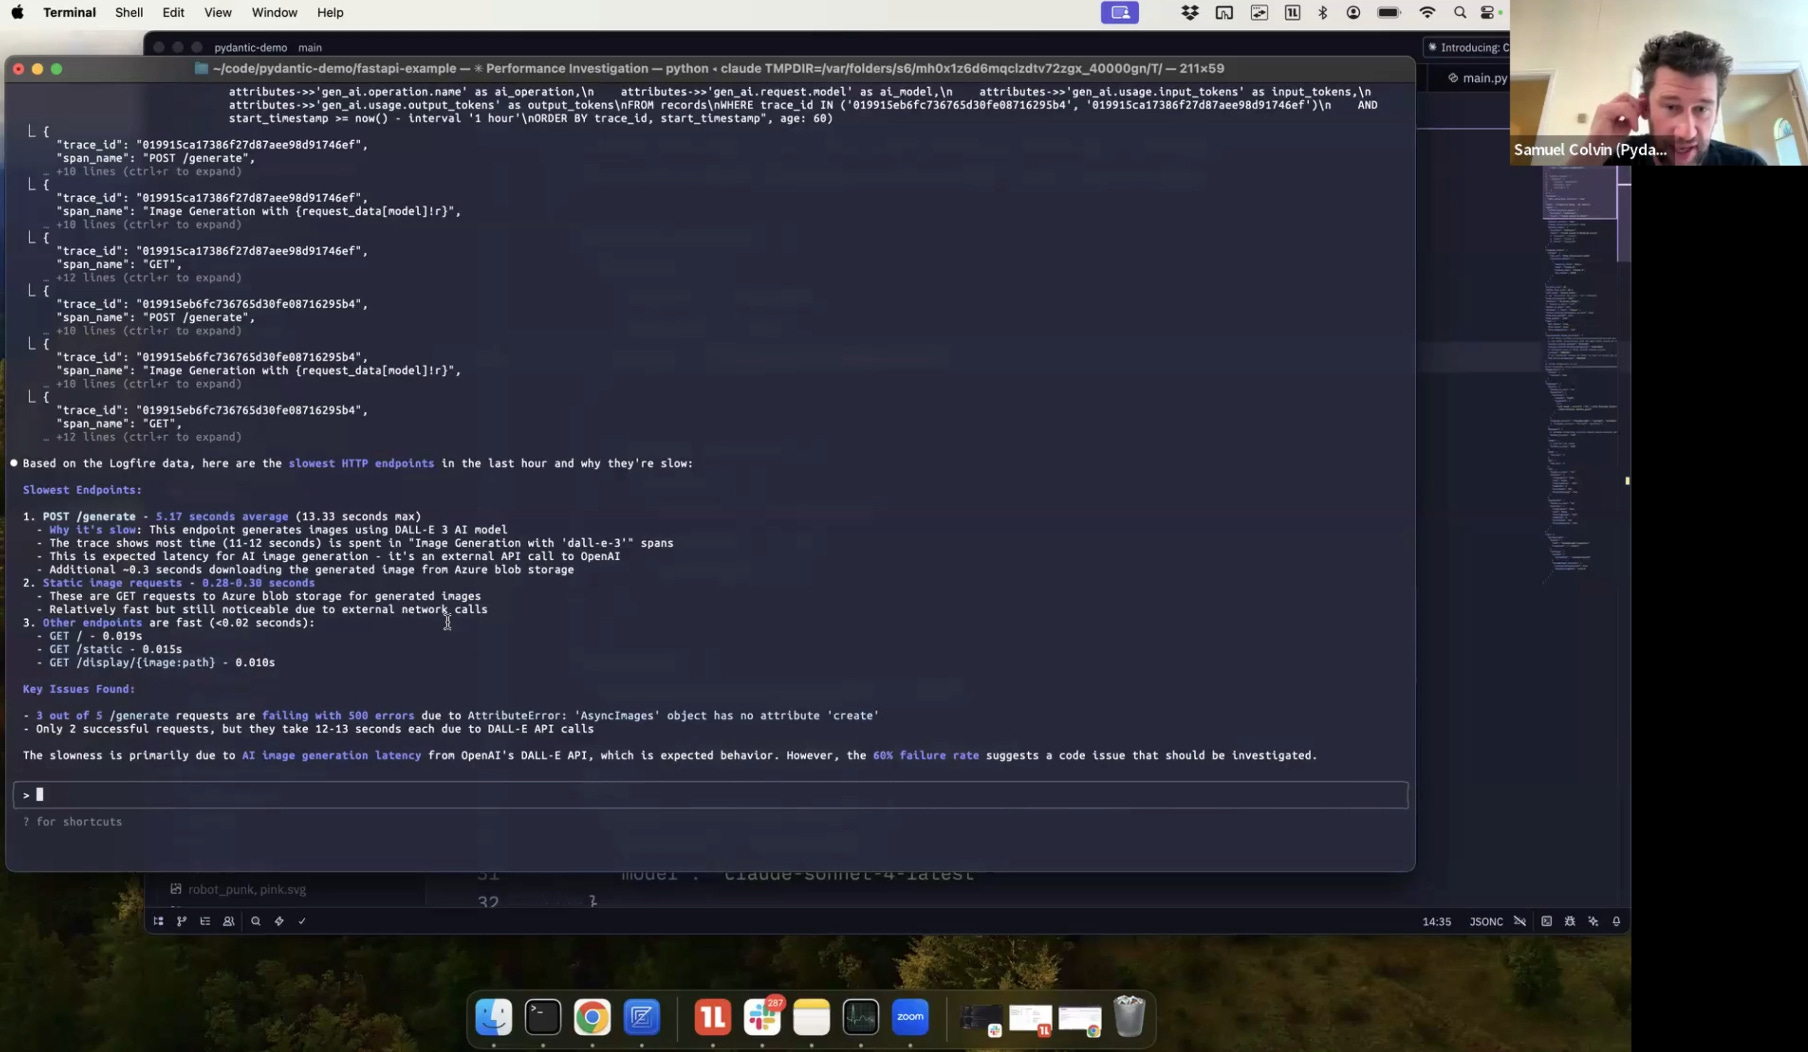
When asked to find the slowest HTTP endpoints, Claude Code autonomously ran multiple SQL queries, handled validation errors, and produced a comprehensive summary. Samuel noted:
"It generated some SQL that was invalid... the response was good enough in indicating what it should do differently that the next time it ran that query, it used
approximate_percentile_contand therefore got back accurate details."
Distributed Tracing Across Services
Samuel explained distributed tracing, a complex concept that Logfire makes manageable:
"Distributed tracing, I'm not going to claim that we invented it. It's part of OpenTelemetry, but we just make it super easy to get set up."
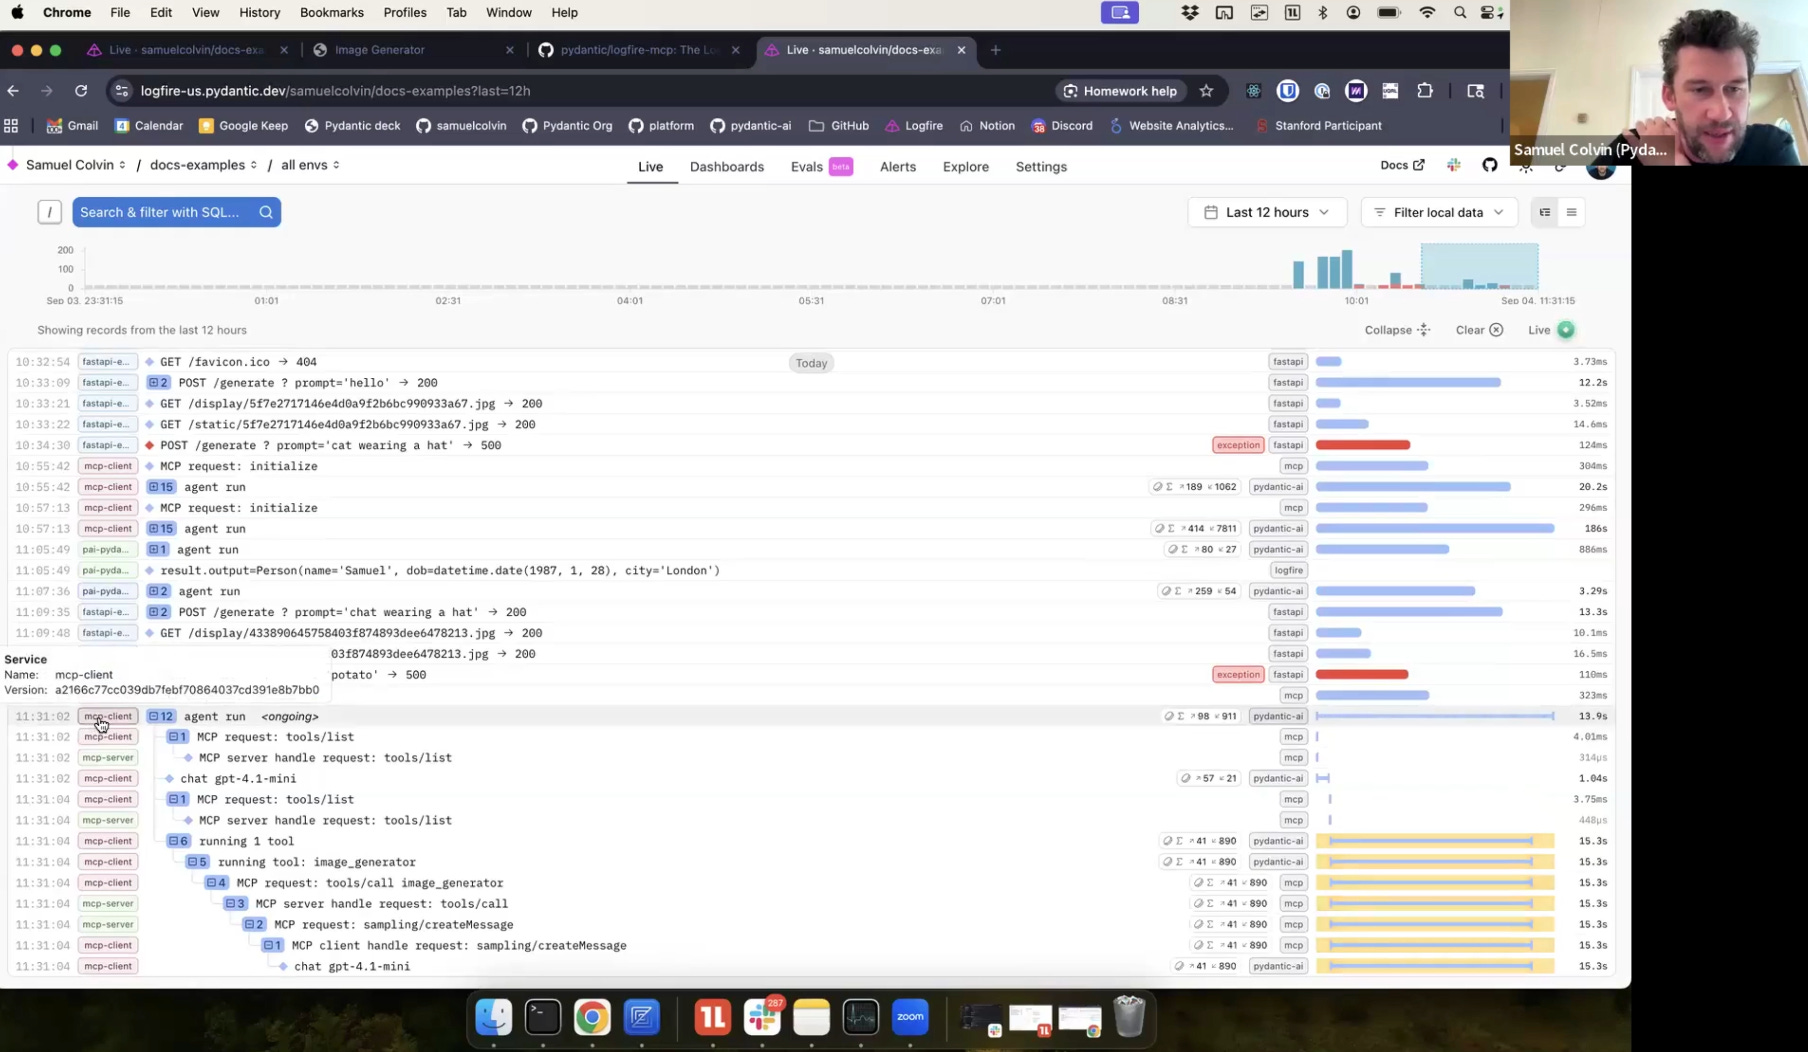
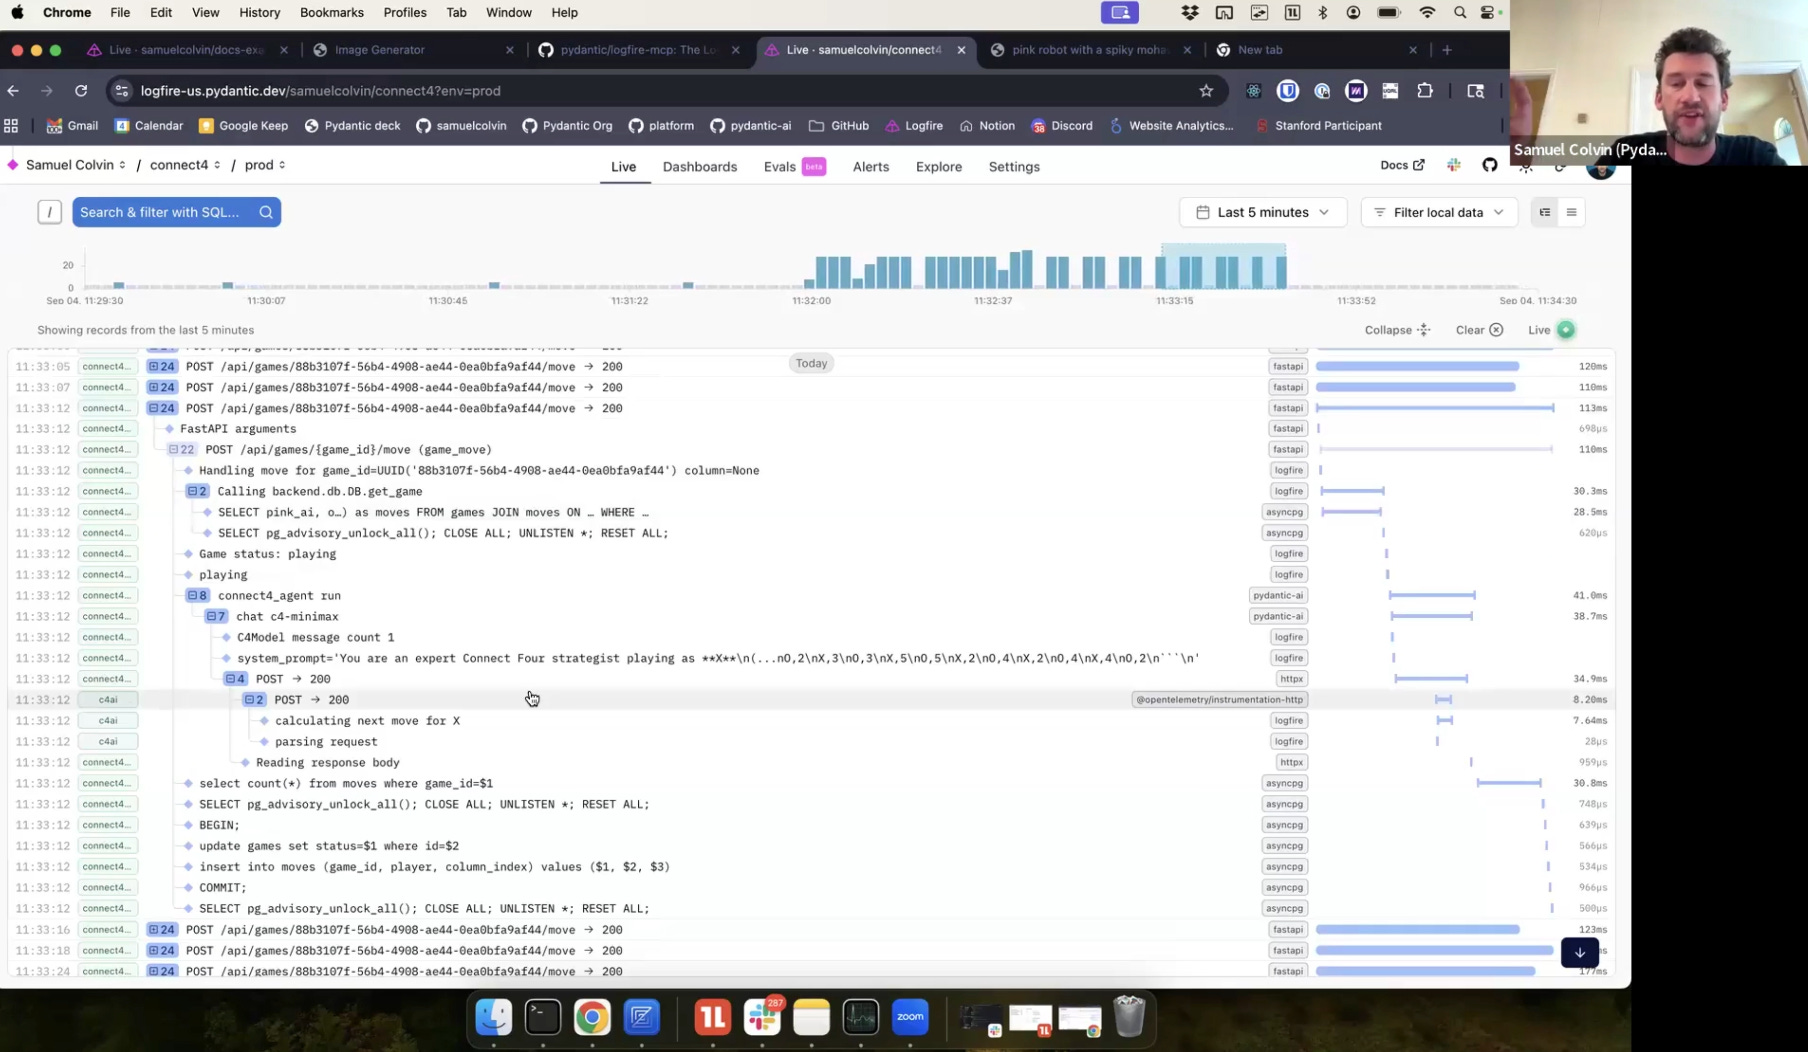
The demonstration showed an MCP client and server communicating, with Logfire assembling traces from both services into a unified view. Samuel showed a Connect Four game example where traces seamlessly crossed between Python and TypeScript services:
"You get this like immediate seamless view of the distributed trace going across the different services and we can have more than two services and it will all just work."
New Evals Features
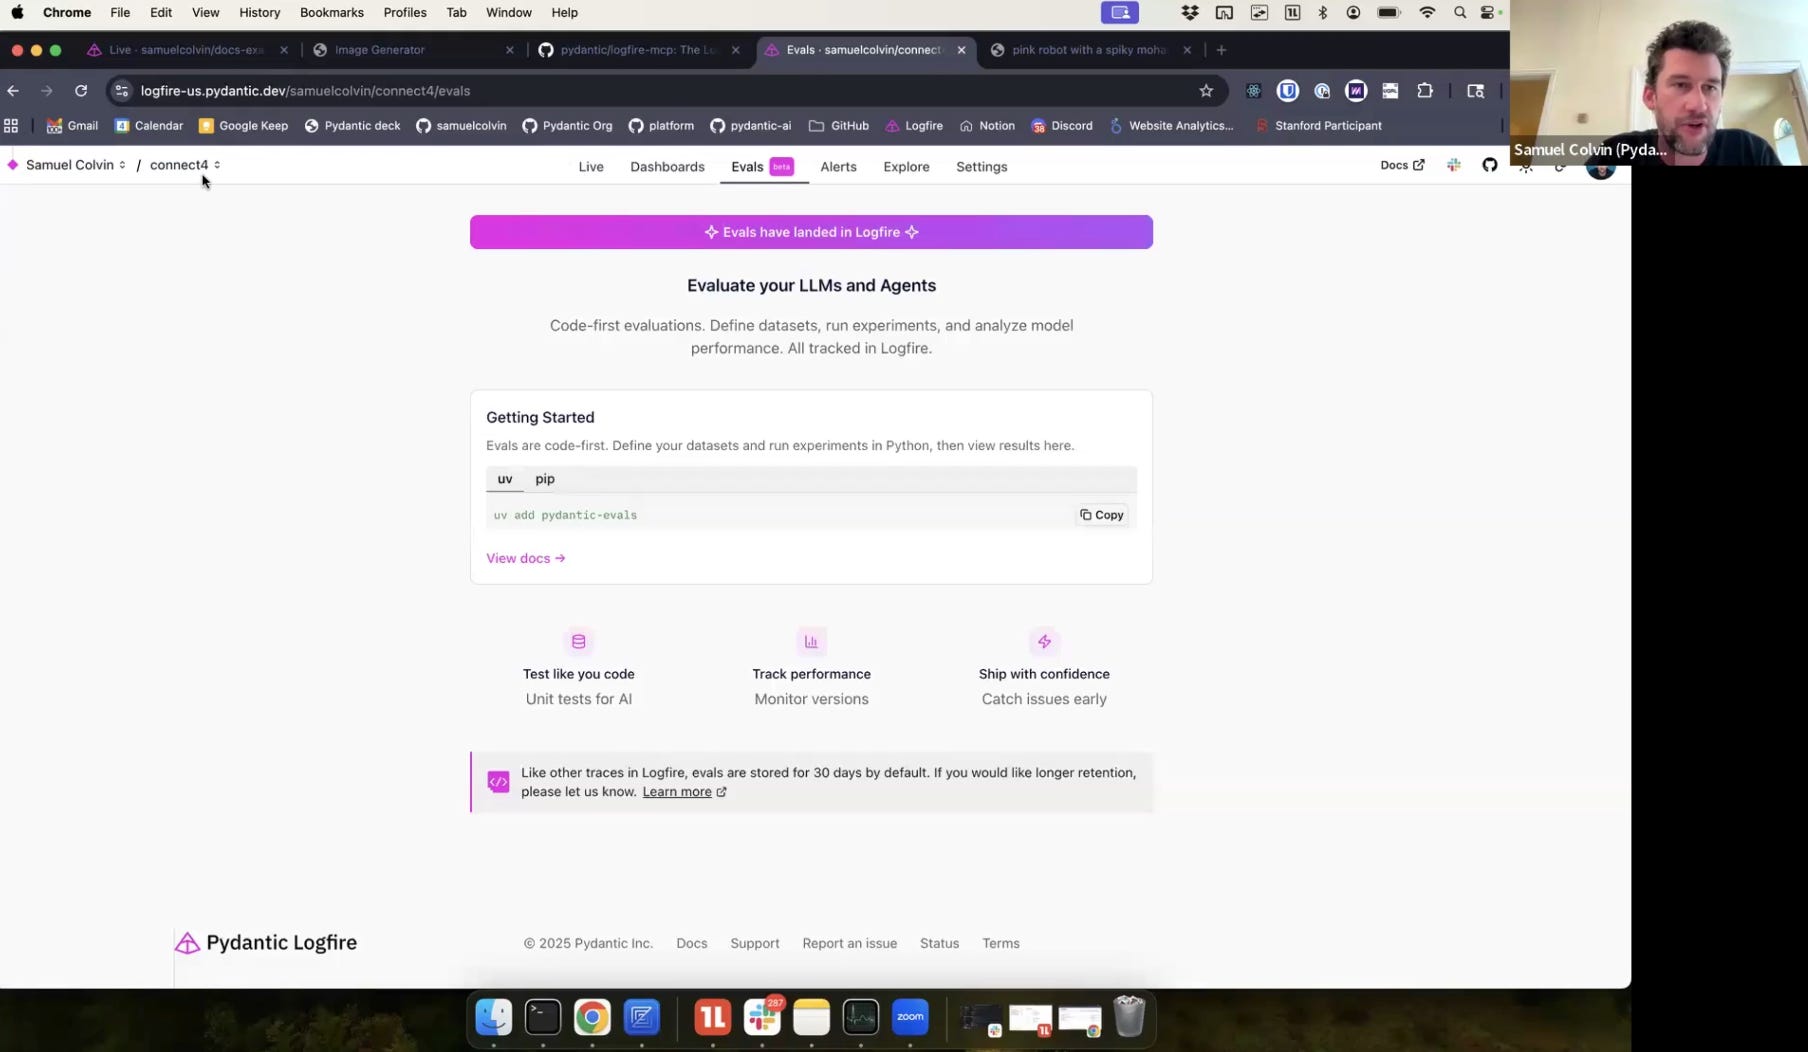
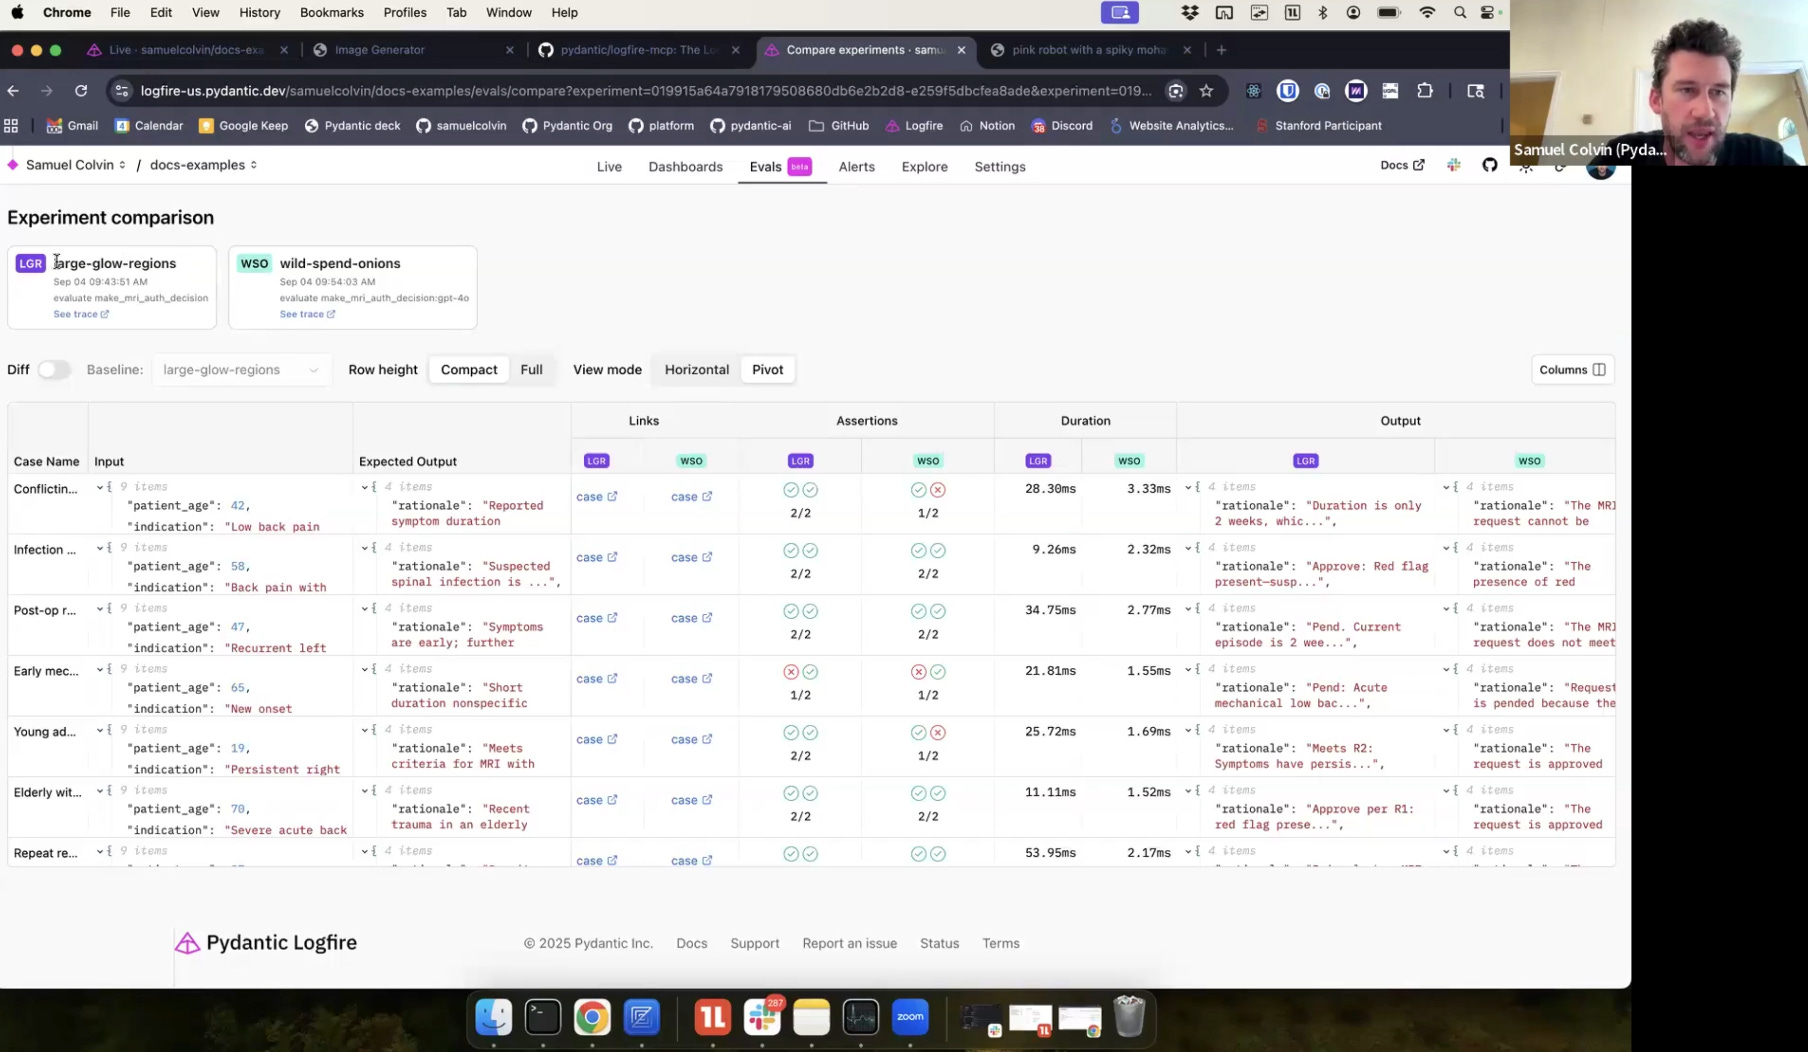
The presentation concluded with Logfire's new evals features, released from beta just the day before. Samuel showed an example where different models were evaluated against golden datasets.
The evals system provided:
Comparison views between different model runs
Pass/fail assertions with detailed explanations
Diff views showing performance variations
Deep dive capabilities into specific traces
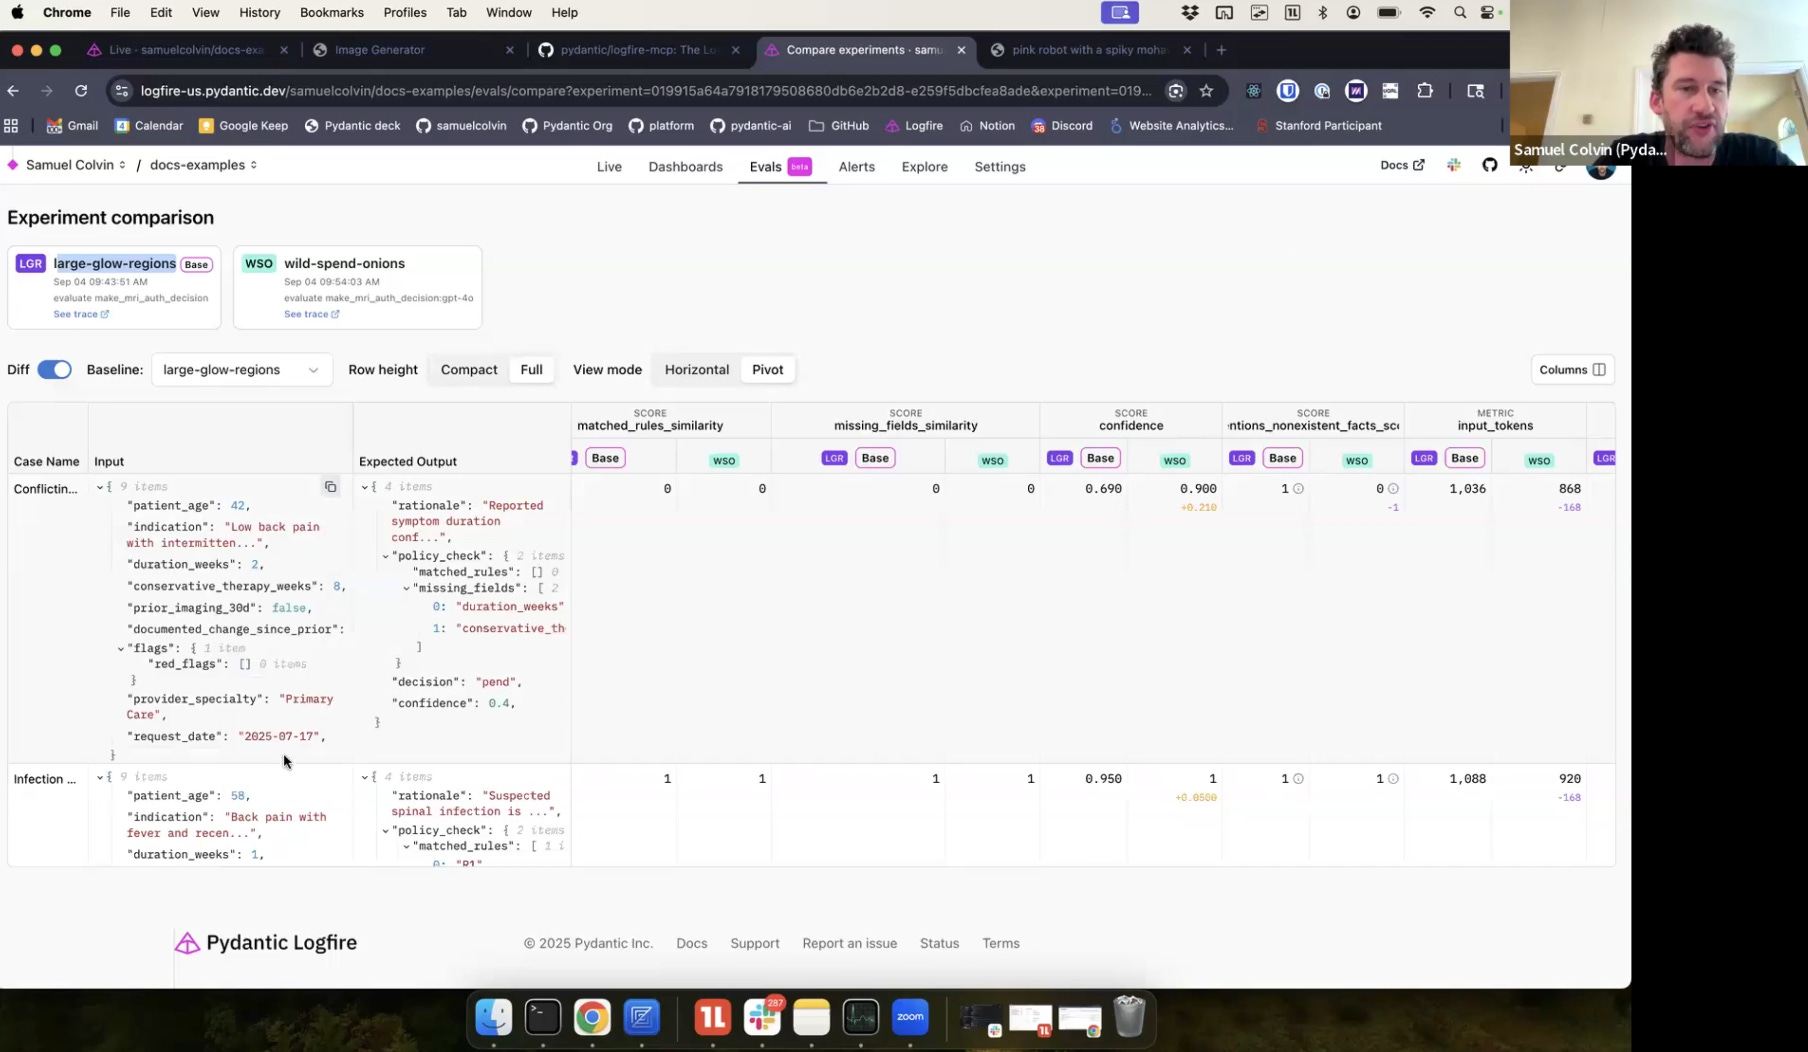
Samuel explained the simplicity of the implementation:
"We're using Pydantic evals, we set up our data sets. In this case, we add an evaluator and we just run evaluate with a max concurrency and a name for the case."
Key Takeaways
The demonstration highlighted several powerful capabilities of the Pydantic stack:
Simple Integration: Adding observability requires minimal code changes
Type Safety: Strong typing throughout the AI pipeline prevents errors
Automatic Debugging: MCP servers can autonomously investigate and fix issues
Full Observability: Traces cover not just AI calls but entire application behavior
SQL Accessibility: Both humans and AI can query data using familiar SQL
Distributed Tracing: Complex multi-service interactions become understandable
Pydantic Logfire offers a generous free tier:
"You get 10 million spans a month free... honestly the 10 million free spans a month is enough for particularly in the AI context you can do an awful lot of stuff on the free tier."
In addition, Pydantic is offering additional $200 in credits to students of Elite AI-Assisted Coding — more than enough to explore all the features demonstrated, use Logfire for the course work, and then some.